Water Quality in Thrissur, Guruvayoor & Kunnamkulam: What Residents Need to Know
TL;DR
Thrissur district is not one water. In the Central Ground Water Board's pre-monsoon 2024 sampling, 5 of 43 district samples were above the iron limit and 5 of 43 above the nitrate limit, while no sample exceeded the fluoride limit. Hardness sits in named pockets rather than everywhere. A 2017 study of 13 samples found sewage contamination in parts of Guruvayur. Get your own supply tested before choosing any system.
Introduction: Understanding Your Local Water
There is no single answer to "what is the water like in Thrissur". The rock changes, the depth changes, the coast is a different aquifer, and the season moves the numbers. That is the honest starting point, and it is the reason this page quotes sample sizes instead of averages. Everything below names the study it came from, so you can check it.
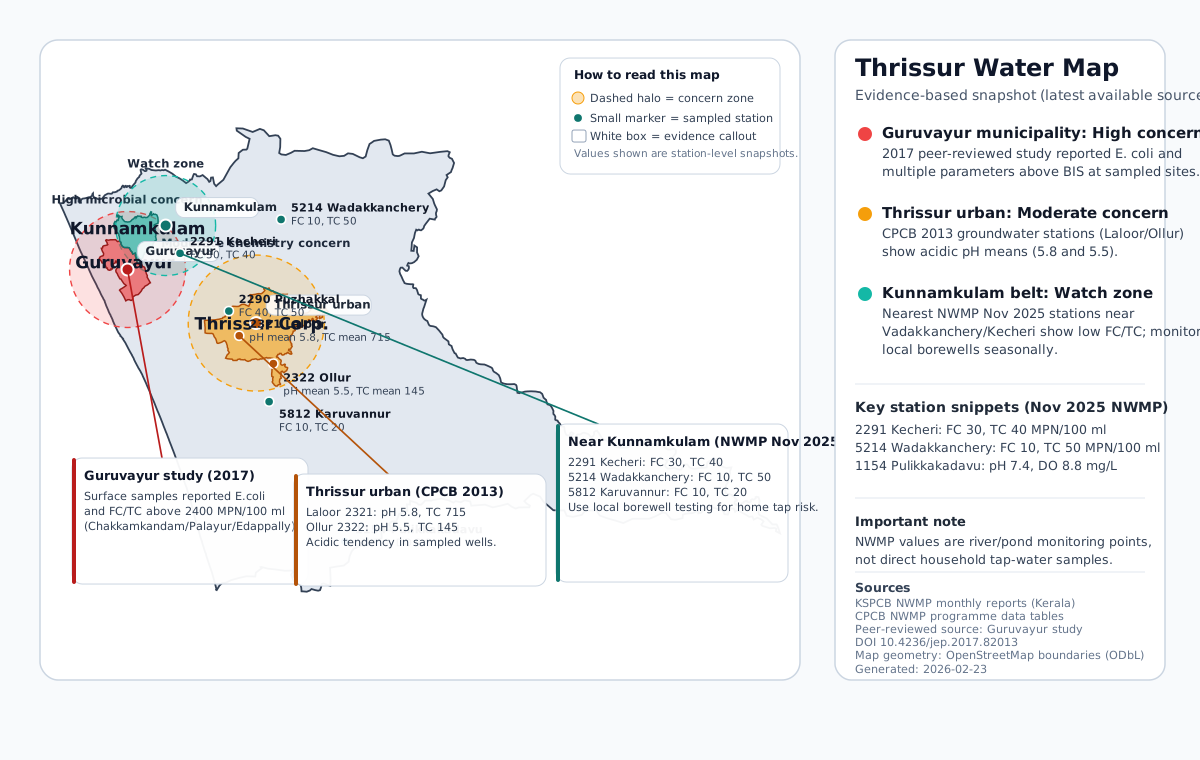
How to read this map in simple language
- Red zone: higher concern area based on published contamination evidence near Guruvayur.
- Orange zone: moderate concern area where sampled stations showed more acidic pH.
- Teal zone: watch zone where seasonal borewell checks are recommended.
- FC, TC, pH, DO labels: station-level snapshots, not a guarantee for every household tap.
Data sources and references
This map is an evidence snapshot built from official monitoring programs and one peer-reviewed local study. You can verify each source here:
- Kerala State Pollution Control Board (KSPCB): water-quality reports and NWMP monthly publications
- Central Pollution Control Board (CPCB): National Water Quality Monitoring Programme (NWMP)
- Peer-reviewed Guruvayur study (DOI: 10.4236/jep.2017.82013)
- OpenStreetMap relation used for Thrissur district boundary geometry (ODbL)
Reliability note: use this map for area-level guidance, then confirm your own home water with a fresh lab or on-site test.
Two rock types sit under this district and they carry different water. The Central Ground Water Board's 2022 aquifer plan for Thrissur splits the district into about 2,123 km² of hard rock inland and about 523 km² of coastal sedimentary ground. An inland well and a coastal well two hours apart are not sampling the same aquifer, and a number from one does not describe the other.
What the Government Sampling Actually Says
A note on which numbers are real
Every figure below names its source, its sample size and its year. That matters more than it sounds. Water-treatment marketing in Kerala repeats district "averages" that came from small monitoring samples, and the drinking-water limits themselves have moved. Iron is the clearest case: the acceptable value is now 1.0 mg/L with no relaxation, not the older 0.3 mg/L that still circulates. Anyone quoting 0.3 will tell you your water fails when it passes.
The most recent district-wide picture
The Central Ground Water Board's pre-monsoon 2024 Kerala bulletin sampled 43 locations in Thrissur district. Against the current limits:
- Iron above 1.0 mg/L: 5 of 43 samples (11.63%)
- Nitrate above 45 mg/L: 5 of 43 samples (11.63%)
- Fluoride above 1.0 mg/L: none
- Electrical conductivity above 750 µS/cm: 2 of 43 samples (4.65%)
Read that carefully before you buy anything. Roughly one district sample in nine had an iron problem — which is a real problem for those homes, and not a reason for the other eight to fit an iron filter. This is a monitoring sample of selected wells, not a survey of every household tap, so it tells you what is common in the district, not what is in your line.
Inland hard-rock wells: the 2019 survey
The Kerala Ground Water Department's 2019 hard-rock terrain report sampled 37 observation wells in Thrissur, 24 in charnockite and 13 in gneiss. Its numbers, against the current acceptable limits:
- TDS: 27 to 426 mg/L, mean 144 mg/L. Every stated value sat below the 500 mg/L acceptable limit.
- Total hardness: 10 to 335 mg/L as CaCO3, mean 90 mg/L, against a 200 mg/L acceptable limit. The report names Karumathra, Karussery, Vadama, Mattathur and Nellayi as the hard-water spots, and calls that hardness temporary, meaning carbonate hardness.
- pH: 6.8 to 9.8, mean 8.2. Just under a fifth of the 37 samples were above 8.5.
- Iron: trace to 9 mg/L, mean 0.7 mg/L. The report compared this against the older 0.3 mg/L figure and reported 73% above it. Against the current 1.0 mg/L value, that 0.7 mg/L mean passes.
So the honest summary for inland Thrissur is: hardness in named pockets, iron in named pockets, and most of the sample inside the limits. If your water is inland and your lab report comes back clean, you may not need a whole-house system at all. We would rather tell you that than sell you a vessel.
Guruvayur: what one study found, and how big it was
A 2017 study published in the Journal of Environmental Protection assessed water in Guruvayur municipality. It took 13 samples in total — 7 groundwater, 2 public supply and 4 surface water — at Chakkamkandam, Palayur and Edappally. It found electrical conductivity, TDS, turbidity, total hardness, chloride and coliform bacteria above Bureau of Indian Standards limits in both groundwater and surface water, and it named the sewage inlets that open directly into the water body as the major source of pollutants.
Thirteen samples at three named locations is real evidence about those locations. It is not a measurement of every well in Guruvayur, and we will not present it as one. The Central Ground Water Board's 2023 shallow-aquifer report separately lists Guruvayur among Thrissur locations with iron above 1 mg/L.
Kunnamkulam and the northern belt
Kunnamkulam town and the panchayats around it sit in the district's dug-well and borewell country. The best sourced local figure we have is nitrate: the Central Ground Water Board's 2022 Thrissur aquifer plan records 53.1 mg/L at Kecheri, above the 45 mg/L acceptable limit, alongside Mupliam at 48.5 mg/L and, further west, Kodungallur at 84 mg/L and Perinjanam at 171 mg/L. Nitrate matters because it does not behave like the other problems. A sediment filter, a carbon filter and an iron filter all leave it exactly where it was.
Where borewell water carries sand, silt, or oxidised iron, the first treatment stage is usually a properly engineered settlement system rather than a bigger filter.
The Four Problems, and Which Ones You Might Have
Hardness
Hardness is calcium and magnesium. It shows up as white scale on taps and kettles, and as soap that will not lather. In the 2019 hard-rock sample the mean was 90 mg/L against a 200 mg/L acceptable limit, so most of those wells were not hard. The named pockets are the exception, and the top of the range was 335 mg/L. Scale on a geyser element makes it work harder to heat the same water; we are not going to put a percentage on that, because we have not measured one.
An ion-exchange softener is the stage that removes hardness. It uses salt, it needs a drain, and it has a running cost. Fit it where a lab report shows you need it. There is more on that in our hard water guide.
Iron
Iron leaves reddish-brown stains on sinks and tiles, gives water a metallic taste, and can feed the slime that blocks pipes. The current acceptable value is 1.0 mg/L, with no relaxation. Where Thrissur wells do exceed it, they can exceed it hard: the 2022 aquifer plan records above-limit locations running from 1.06 mg/L to 15.5 mg/L, and names iron pockets at Mathilakom, Wadakkanchery, Chavakkad, Irinjalakuda, Thalikulam, Pazhayannur and Chowannur. The 2023 shallow-aquifer report adds Cherpu, Guruvayur, Kallur, Trichur and Wadakkancherry.
The tell worth reporting to us is timing. Water that runs clear at the tap and turns yellow or brown in a bucket an hour later is dissolved iron meeting air. That changes what the system has to do — it has to oxidise the iron first, then filter the solids out.
Salt, in the coastal belt
Inland TDS numbers say nothing about the coast. The 2022 aquifer plan reports a deep coastal tube well at Nattika at TDS 1,540 mg/L and chloride 715 mg/L, and describes the deeper coastal aquifers as brackish. It also records Kole-land salinity rising with the tide and climbing from February to May. These problems are local and seasonal, so a single reading in one month is not the whole story.
Only reverse osmosis brings dissolved salt down. Sand, carbon and iron media do not touch it.
Microbes
This is the one that a filter salesman should be most careful about. A study of 80 open-well samples at Anthikkad, 40 before the monsoon and 40 after, found coliforms in 91.25% of samples and E. coli in 37.5%, with higher mean counts after the monsoon. Mean turbidity was 3.70 NTU before the monsoon and 2.87 NTU after — so in that study the monsoon did not make the water cloudier, it made it more likely to carry bacteria.
A smaller 2015 study sampled one well in each of seven Thrissur towns before the 2014 monsoon and detected E. coli at Thrissur town, Guruvayoor and Laloor. Seven wells cannot tell you how common the problem is. They can tell you it exists here, which is enough reason to test.
The current requirement is that E. coli must not be detectable in any 100 mL sample. No sediment filter, carbon filter, iron filter or softener can prove that for you. Only a lab test can, and only a validated disinfection stage such as UV — placed after the water is clear — answers it.
Reading Your Own Lab Report
Once you have a report, the treatment follows from it. Each stage does one job and does not do the others.
- Hardness above 200 mg/L: an ion-exchange softener. It uses salt and needs a drain. It does not remove sediment, iron in every form, salt or microbes.
- Iron above 1.0 mg/L: oxidation, then a backwashing iron filter to catch the solids. Tell us whether the water is clear at the tap and turns colour later — that decides the design.
- TDS and chloride high, near the coast: reverse osmosis, at the drinking tap. No filter media lowers dissolved salt. Check whether the source itself is brackish before spending on a whole-house system.
- Sand and silt: settlement or a multigrade sand filter first, so the finer stages behind it are not blocked in a month.
- Coliforms or E. coli: protect the source, then a validated disinfection stage, placed last, after the water is clear. Whole-house filtration on its own does not answer this.
- Nitrate above 45 mg/L: none of the stages above. This needs a different approach, and it is worth finding out what is reaching the source.
- Everything inside the limits: then nothing, for now. Retest before the next pre-monsoon.
If you are on municipal piped water in Thrissur city, sediment and activated carbon usually cover what you actually need. That is a much smaller job than a full whole-house system, and we will say so.
Why Season and Location Both Matter
Two things in the evidence keep catching people out.
- The season changes the answer. The 2022 aquifer plan reports higher coliform counts after the monsoon and coastal salinity climbing from February to May. A report taken in one month is a snapshot.
- The district is not one aquifer. Inland hard-rock chemistry and coastal sedimentary chemistry are different, so a number from Wadakkanchery does not describe a well in Nattika.
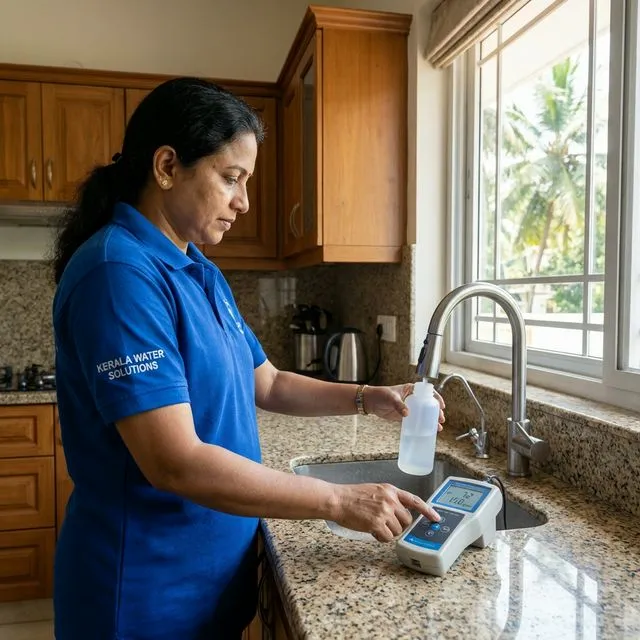
We test TDS, pH and do a visual and site check for free. A lab test is needed before the final design, because those three checks cannot tell hardness from chloride from nitrate, and they cannot see bacteria at all.
Where the Numbers on This Page Come From
Every figure above is from one of these. Read them yourself if you want to check us.
- Central Ground Water Board, Kerala Groundwater Chemical Quality Bulletin, pre-monsoon 2024 — 43 Thrissur samples; iron, nitrate, fluoride and conductivity exceedance counts.
- Kerala Ground Water Department, Water Quality Report — Hard Rock Terrain, Kerala (2019) — the 37-well Thrissur hard-rock sample; TDS, hardness, pH and iron ranges and the named hard-water locations.
- Central Ground Water Board, Aquifer Mapping and Management Plan of Thrissur District (2022) — hard-rock and coastal areas, the Nattika TDS and chloride readings, iron and nitrate locations, seasonal coliform and salinity behaviour.
- Central Ground Water Board, Ground Water Quality in Shallow Aquifer of Kerala (2023) — Thrissur locations above 1 mg/L iron.
- Assessment of Water Quality Status of Guruvayur Municipality, Journal of Environmental Protection (2017) — the 13-sample Guruvayur study and the sewage-inlet finding.
- Anthikkad open-well study (2019) — 80 samples, coliform, E. coli and seasonal turbidity figures.
- Seven-town Thrissur well study (2015) — one well per town, pre-monsoon 2014, E. coli detections.
- Jal Jeevan Mission, Drinking Water Quality Monitoring & Surveillance Framework — the current acceptable and permissible limits used throughout, including iron at 1.0 mg/L with no relaxation.
What to Do Next
Get a lab report for your own supply. Send it to us and we will tell you what it means, including when the answer is that you do not need a system. If you want us to look at the property first, our free check covers TDS, pH and a visual and site inspection — enough to know what to test for, not enough to design from.
The number that decides your system is the one measured at your tap, not a district average.
- In the Central Ground Water Board's pre-monsoon 2024 sampling of 43 Thrissur locations, 5 were above the 1.0 mg/L iron limit and 5 were above the 45 mg/L nitrate limit. No sample exceeded the fluoride limit.
- The Kerala Ground Water Department's 2019 survey of 37 hard-rock wells in Thrissur found hardness from 10 to 335 mg/L, mean 90 mg/L, against an acceptable limit of 200 mg/L. Hard water is a pocket problem here, not a district-wide one.
- The same 37 wells had TDS from 27 to 426 mg/L, all below the 500 mg/L acceptable limit. High salt is a coastal-belt problem: a deep tube well at Nattika measured TDS 1,540 mg/L and chloride 715 mg/L.
- A 2017 study of 13 samples in Guruvayur found chemical and bacterial contamination at Chakkamkandam, Palayur and Edappally, and named sewage inlets opening into the water body as the source.
- Colour, smell and a TDS meter cannot tell you which problem you have. Get a lab report first, then choose the system.
Need help with your water?
The first whole-house site visit and consultation are free, with TDS and pH readings and a visual site assessment. A lab test is required before the final quote and system design.
Book a consultationOn this page
- Introduction: Understanding Your Local Water
- How to read this map in simple language
- Data sources and references
- What the Government Sampling Actually Says
- A note on which numbers are real
- The most recent district-wide picture
- Inland hard-rock wells: the 2019 survey
- Guruvayur: what one study found, and how big it was
- Kunnamkulam and the northern belt
- The Four Problems, and Which Ones You Might Have
- Hardness
- Iron
- Salt, in the coastal belt
- Microbes
- Reading Your Own Lab Report
- Why Season and Location Both Matter
- Where the Numbers on This Page Come From
- What to Do Next
Share Article
Need help with your water?
The first whole-house site visit and consultation are free, with TDS and pH readings and a visual site assessment. A lab test is required before the final quote and system design.
Book a consultation